Note
Go to the end to download the full example code.
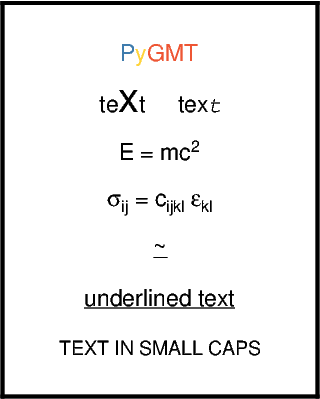
Text formatting
There are various options for formatting text contained in a plot, e.g., text added
via pygmt.Figure.text, the plot title, labels of colorbars as well as
Cartesian axes, and legend entries. It’s also possible to change the font as well
as its color and size only for specific characters of a longer text. The supported
fonts are listed at Supported Fonts. For an complete
overview see Text Formatting.
import pygmt

fig = pygmt.Figure()
fig.basemap(region=[-1, 1, -4, 4], projection="X4c/5c", frame=0)

# Change font color for specific characters of the word "PyGMT"
# blue for "P", yellow for "y", and red for "GMT"
fig.text(x=0, y=3, text="@;63/124/173;P@;;@;255/212/59;y@;;@;238/86/52;GMT@;;")

# Change font size and style for one single character, respectively
fig.text(x=0, y=2, text="te@:15:x@::t     tex@%Courier-Oblique%t@%%")

# Use superscript
fig.text(x=0, y=1, text="E = mc@+2@+")

# Use subscripts and Greek letters
fig.text(x=0, y=0, text="@~s@~@-ij@- = c@-ijkl@- @~e@~@-kl@-")

# Combine two characters above each other
fig.text(x=0, y=-1, text="@!_~")

# Underline the text
fig.text(x=0, y=-2, text="@_underlined text@_")

# Use small caps
fig.text(x=0, y=-3, text="@#text in small caps@#")

fig.show()
Total running time of the script: (0 minutes 0.107 seconds)